Time series analysis and forecasting using the ARIMA model with Statsmodels
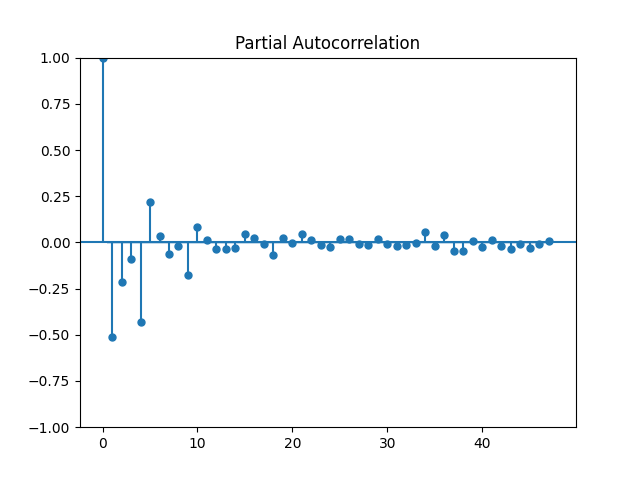
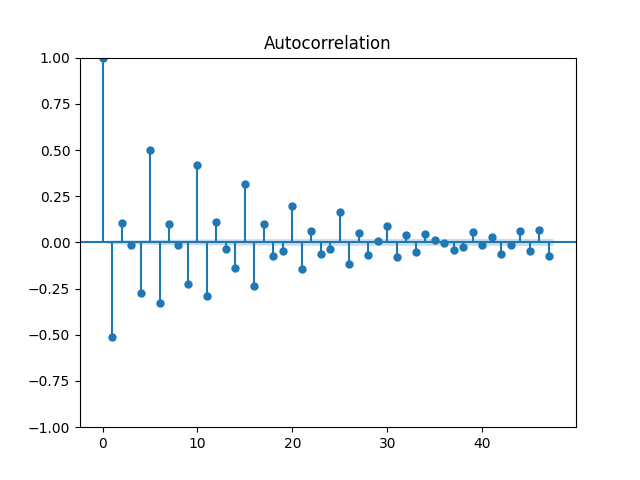
ACF and PACF Plots
The Auto-Correlation Function (ACF) and Partial Auto-Correlation Function (PACF) of the differenced data to help determine the appropriate order of the ARIMA model's parameters (p, d, q).
The output includes: - ACF and PACF plots that help identify the AR and MA terms. - The plots show the original transaction data along with the ARIMA model's forecast, visually representing the model's prediction of future values.